Because neighborhoods are central to children’s healthy development, it is important to know where children live in relation to neighborhood opportunity—and whether children of different races/ethnicities have equal access to the conditions and resources that help them thrive. The Child Opportunity Index allows us to answer questions like these.
To summarize inequities in children’s access to opportunity, we calculate the median Child Opportunity Score by racial/ethnic group for each metro area. The score for a given racial/ethnic group represents the neighborhood opportunity experienced by the typical (median) child of that racial/ethnic group in that metro area.
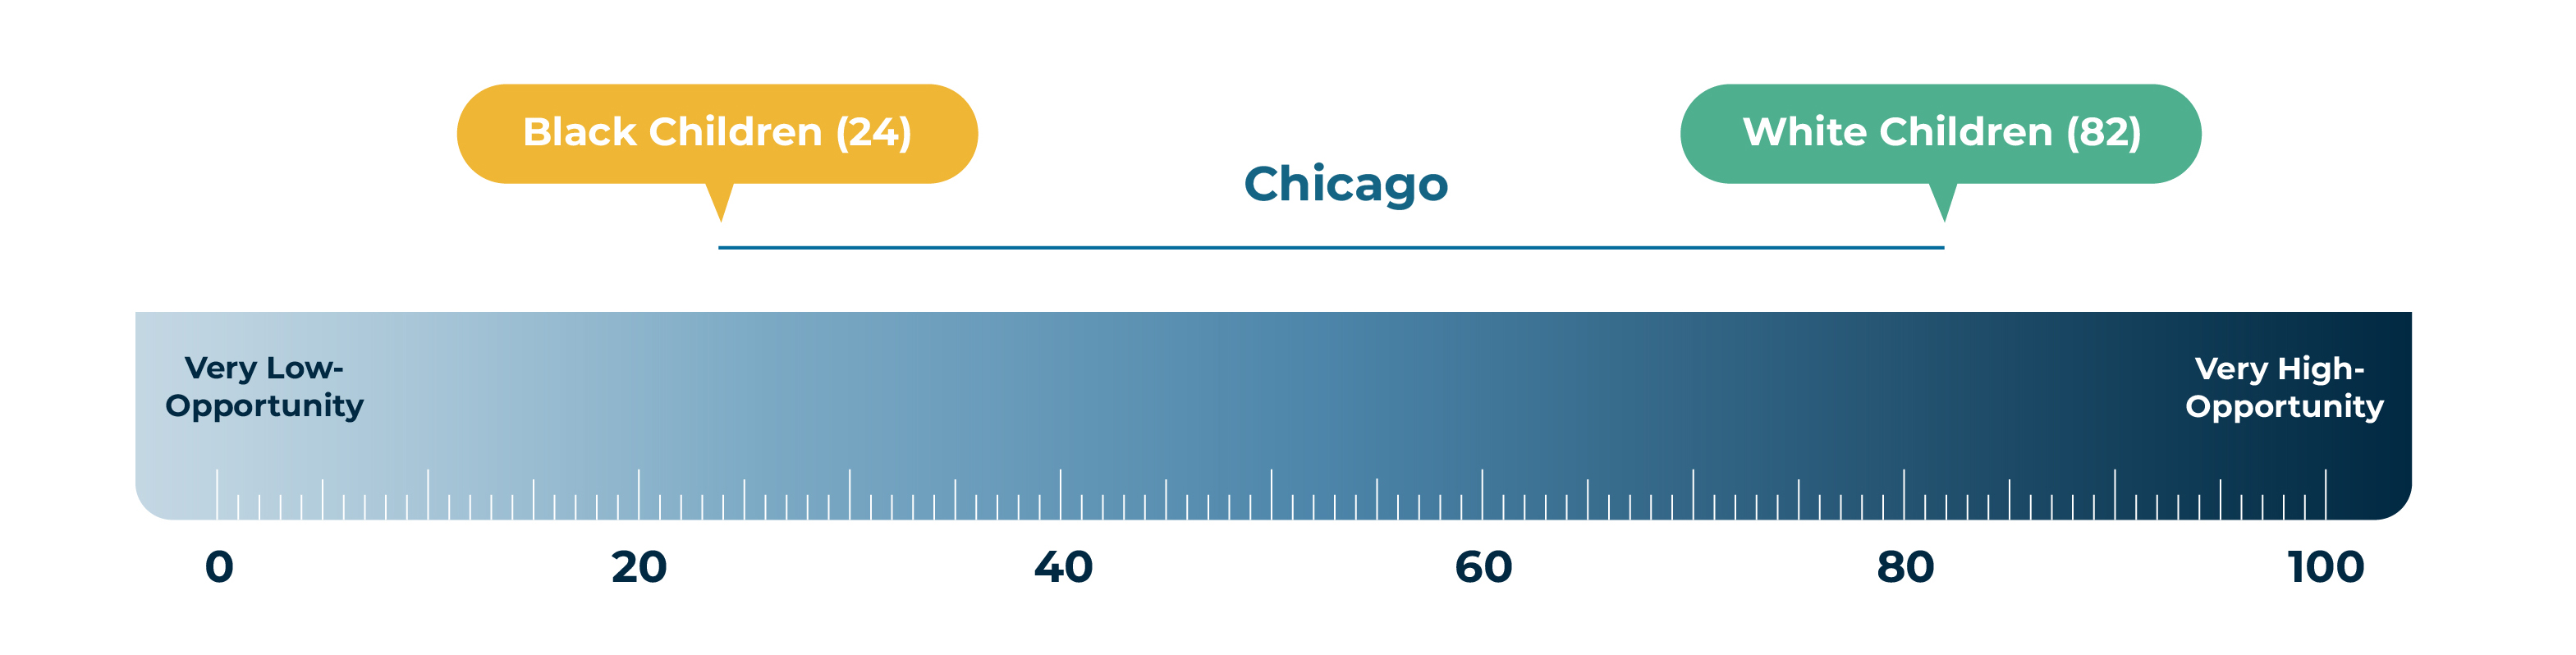
For example, as the ruler below shows, in the Chicago metro area, the typical White child lives in a neighborhood with a Child Opportunity Score of 82, while the typical Black child lives in a neighborhood with a score of only 24. This racial gap in Chicago spans four opportunity levels: the typical Black child lives in a low-opportunity neighborhood, while the typical White child lives in a very high-opportunity neighborhood.
The Chicago opportunity chasm between Black and White children
Child Opportunity Scores by race/ethnicity
This pattern of inequity is not unique to Chicago. Racial/ethnic opportunity gaps are remarkably consistent across the 100 largest metropolitan areas. Throughout the country, Black and Hispanic children live in neighborhoods with much lower Child Opportunity Scores than White and Asian children.
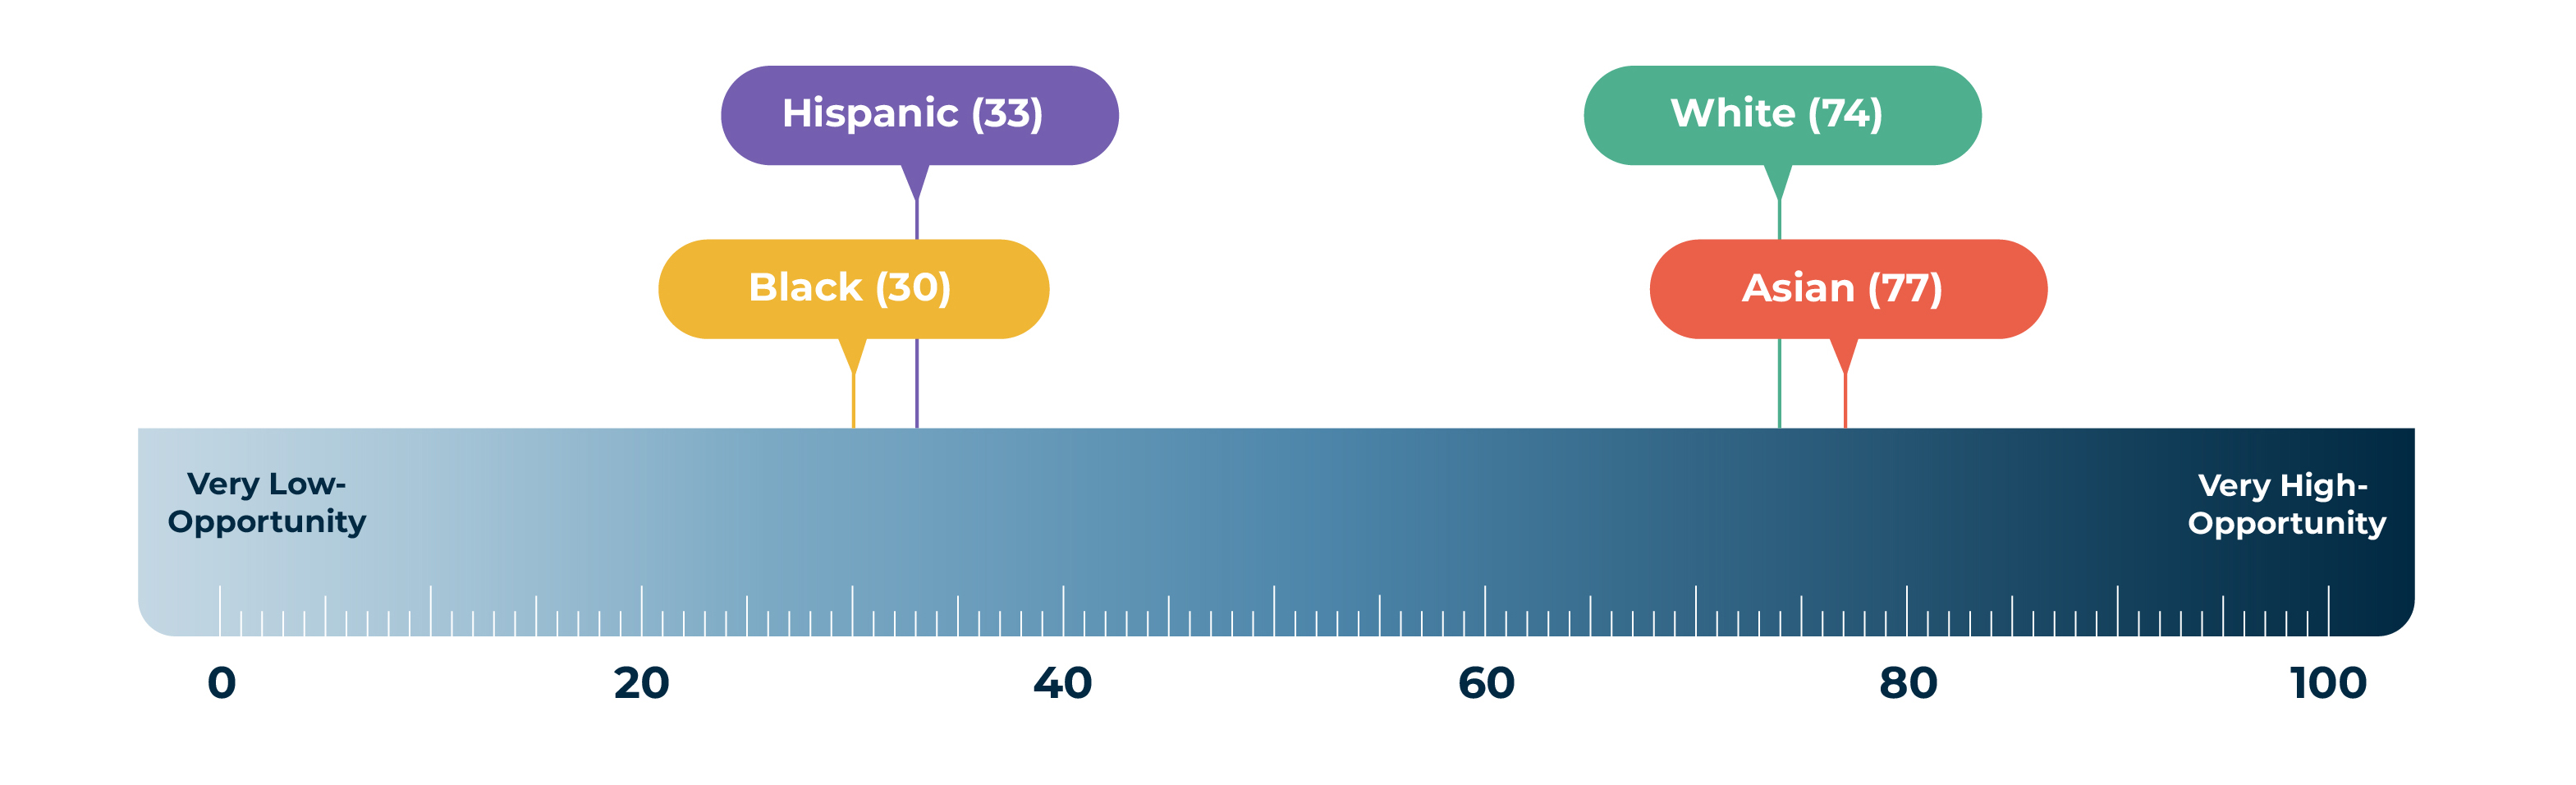
All told, for the 100 largest metro areas combined, the Child Opportunity Score that the typical White child experiences is 74, compared to 77 for Asian children, 33 for Hispanic children and 30 for Black children.
The Child Opportunity Gap by race/ethnicity in the 100 largest metro areas
The graph below shows Child Opportunity Scores by child race/ethnicity for each of the 100 largest metro areas. As you scroll down, notice that the gap between the Child Opportunity Score for Black children (yellow dots on the left) and White children (green dots on the right) expands or contracts depending on the metro area—but persists nearly everywhere. A similar pattern of inequity exists between White and Hispanic children (purple dots). You can also sort the graph by the White-Black or White-Hispanic opportunity gap (widest to smallest). To understand what these patterns of inequity look like in the metros that are home to a relatively large number of children, select the “Modify dot sizes by relative child population size.”
What if children had equitable access to opportunity in neighborhoods?
If access to neighborhood opportunity were equitable, a child’s race or ethnicity would not be a factor, and the Child Opportunity Score for each racial/ethnic group in each metro area would be similar. In that equitable scenario, if we were to rank metro areas according to their Child Opportunity Score (which indicates the overall opportunity for the typical child in that metro), the median Child Opportunity Scores for White, Black, Hispanic and Asian children would all be the same as the overall score of the entire metro. The hypothetical example below shows just that: Neighborhood opportunity still differs across metros (as illustrated by the slope of the line), but children in a given metro area experience the same level of opportunity, regardless of race or ethnicity—so there is no variation above or below the 45-degree line.
We had to create this hypothetical situation to illustrate how equity could look—because in all of the 100 largest metro areas, the reality is strikingly different.
In reality, child opportunity is starkly divided. The graph below shows that the typical White or Asian/Pacific Islander child in nearly all 100 metro areas lives in neighborhoods with scores above the 45-degree line, which means that the Opportunity Scores for White and Asian/Pacific Islander children are well above the overall Opportunity Score in their metro. On the other hand, in nearly all 100 metros, the typical Hispanic or Black child lives in neighborhoods with scores below the 45-degree line, which means that the Opportunity Scores for Hispanic and Black children are well below the overall Opportunity Score in their metro.
The chart currently shows inequities between Black and White children. You may make other selections with the checkboxes, and/or opt to vary the dot size based on relative child population in that metro area.
Where do children live in relation to opportunity?
The five Child Opportunity Levels are a helpful tool for summarizing whether all children have equitable access to neighborhood opportunity. By construction, each opportunity level includes 20% of the 2021 U.S. child population. However, when we examine access to opportunity by race/ethnicity, we do not see an even distribution of children across the five levels. White and Asian children are concentrated in high- and very high-opportunity neighborhoods, while Black and Hispanic children are concentrated in very low- and low- opportunity neighborhoods. This pattern of inequity is pervasive across the country.
Use the tool below to see where children live across the five levels of neighborhood opportunity in a given metro area.
Note: We omitted American Indian/Alaska Native (Indigenous) children from this analysis. Indigenous children live in neighborhoods with, on average, very low-opportunity, similar to Black and Hispanic children. However, given their relatively small number, reliable metro-level statistics cannot be computed for Indigenous children for many of the 100 largest metro areas.
Learn more about the Child Opportunity Index 3.0
Explore child opportunity in your metro area
Read our full report: The State of Racial/Ethnic Equity in Children's Neighborhood Opportunity: First Findings from the Child Opportunity Index 3.0